Deep Dive: E9G07
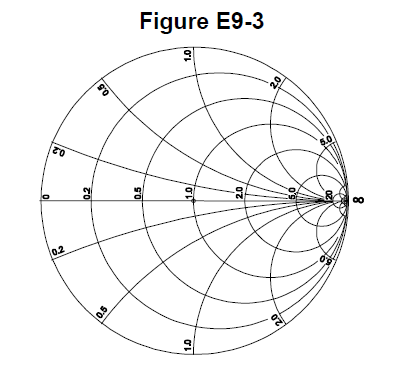
The correct answer is D: The resistance axis. On the Smith chart shown in Figure E9-3, the only straight line shown is the resistance axis. This is the horizontal line through the center of the chart. The resistance axis is the horizontal diameter of the Smith chart. It represents pure resistance (zero reactance) - points on this line have no reactive component. The center of the chart (where the resistance axis crosses) represents the normalized impedance (typically 1.0 or 50 ohms, depending on normalization). The resistance axis is the only straight line on the chart - all other lines (resistance circles and reactance arcs) are curved. This straight line divides the chart into upper (inductive) and lower (capacitive) halves.
Why Other Answers Are Wrong
Option A: Incorrect. The reactance axis is the outer circle, not a straight line. The only straight line is the resistance axis. Option B: Incorrect. There's no 'current axis' on a Smith chart. The only straight line is the resistance axis. Option C: Incorrect. There's no 'voltage axis' on a Smith chart. The only straight line is the resistance axis.
Exam Tip
Smith chart straight line = Resistance axis. Remember: The only straight line on a Smith chart is the resistance axis - the horizontal line through the center representing pure resistance (zero reactance).
Memory Aid
**S**mith **C**hart **S**traight **L**ine = **R**esistance **A**xis (think 'SCSL = RA')
Real-World Example
You look at a Smith chart. There's one straight line - the horizontal line through the center. This is the resistance axis, representing pure resistance with no reactance. All points on this line have zero reactance. The center point represents the normalized impedance (typically 1.0 or 50 ohms).
Source & Coverage
Question Pool: 2024-2028 Question Pool
Subelement: E9G
Reference: FCC Part 97.3
Key Concepts
Official Pool Source
Question text and answer key are synchronized with the current NCVEC Extra Class pool and mapped to the E9G topic.